Overview of Statistics

This quick introduction will help you to use Ogulo quickly and efficiently. We recommend that you carry out the steps explained here simultaneously using your own Ogulo access, in order to ensure that you have understood everything fully.
Under the Statistics tab you can display the visitor analytics sorted by your properties and your visitors. However, you will receive statistics only if you have chosen either “E-Mail Authentication” or “Manual Authentication” as the release option for your virtual tours. This means that a visitor must register for the virtual 360° tour first or you must grant them access manually in order for you to be able to view the statistics later.
General User Settings
In the top left-hand corner you can see which part of the statistics you are looking at as well as a description which will help you to interpret these statistics.

Time Filter

On the right above the tour overview you have the option of narrowing down the timeframe of the recorded statistics. Click on “Timeframe” and then select a timeframe from the dropdown menu or enter a custom timeframe. The option to narrow down the timeframe is available for all Statistics menu items.
Display Options
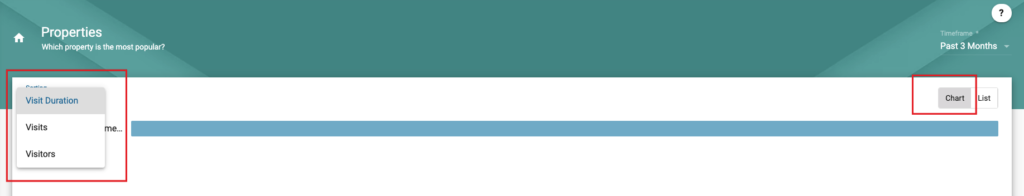
In the top right corner of the tour overview you have the option of choosing between two statistics displays. You can choose between “Chart” and “List”.
- 1. Chart
If you select Chart, the visitor statistics are shown to you in the form of a bar chart. Click on “Sorting” in the top left corner and a dropdown menu opens which allows you to select the key figure by which the statistics are sorted.
- 2. List
In the List view, you are shown the visitor statistics in the form of a table/list. As with the chart display, you can sort your statistics. You can do this by clicking on the title of a column (e.g. Visit Duration).
Furthermore, there is a magnifying glass directly below the “Chart/List” buttons. Click on this to search for a tour in a search box to the left.
The above-mentioned options and settings can be found on each statistics page.
Viewing Statistics
There are two options for viewing your statistics.
- Sorted by property
- Sorted by visitor
Sorted by property
In this menu item, you have an insight into how often and for how long your properties are viewed and which visitors view these properties. You can also find out how much time a visitor spent viewing a certain room of the property.
To view your statistics sorted by property, proceed as follows:
- Click on “Properties” to the left in the main menu under Statistics to find out how often your properties are visited virtually.
- Properties – Which property is the most popular? Here, you have an overview of all the tours that you currently have set to active. You can now see how many visitors have viewed your properties virtually, the duration of their visit in the respective tour, how many visitors have accessed a particular tour, how many visitors are registered for this property and when the last visit to the property took place.

3. Visitors – Which visitor showed the most interest? Click on one of the properties listed to see an overview of the statistics of all visitors to the selected property. Here you can also view the visit duration, the number of visits and the last visit by the visitor.
4. Rooms – Which room did the visitor like best?
Click on the name of a visitor again to see an overview of the rooms viewed by the selected visitor. Here you are shown the room, the visit duration and the number of visits that this visitor has made.
Sorted by visitor
The visitor statistics can also be viewed by clicking on Visitors. Instead of the properties, you will initially see the statistics for all visitors.
By selecting a visitor, you will open an overview of the properties visited virtually by this visitor. By clicking on a property, you will open the aforementioned room statistics.
Next article: Ogulo Quick Introduction: Step 7, App
Previous article: Ogulo Quick Introduction: Step 5, Visitors